Vanishing Marine Algae Can Be Monitored From a Boat With Your Smartphone
An app allows boat travelers to track declining levels of phytoplankton, a microscopic organism at the base of the marine food chain
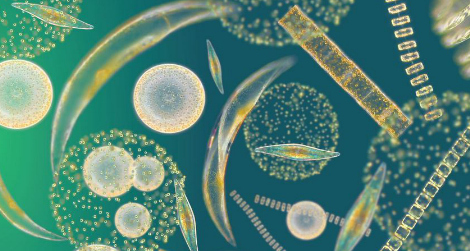
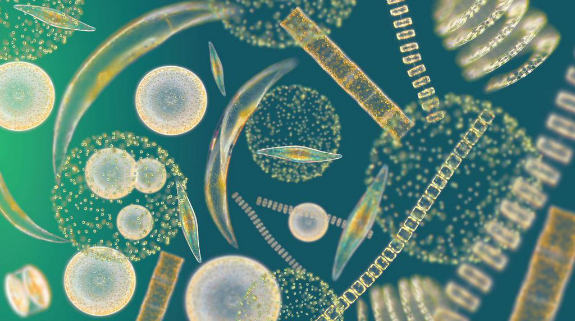
Warming oceans have caused levels of phytoplankton, like the mixed sample of single-celled and chain-forming diatoms pictured above, to decline 40 percent since 1950. Photo by Richard Kirby
Two weeks ago, a group of sailors off the coast of New Zealand leaned over the side of their boat, dropped a contraption into the Pacific Ocean and watched it disappear. Using an app they’d downloaded to a smartphone, they logged a reading from the underwater device, along with their GPS location and the water temperature. In just a few minutes’ time, they had become the first participants in a new program launched by the UK’s Plymouth University Marine Institute which allows citizen scientists to help climatologists study the effects of climate change on the oceans.
The Kiwi sailors were measuring the concentration of phytoplankton, a microorganism that lives at the sea surface. Phytoplankton, also called microalgae, produce half of the oxygen in the air we breathe and are responsible for 50 percent of the Earth’s photosynthesis. Whales, jellyfish, shrimp and other marine life feast on it, making it a critical part of the marine food chain.
Phytoplankton require a certain water temperature to thrive (this varies regionally), and without these favored conditions, they either decrease in number or migrate in search of optimal water. As the upper levels of the Earth’s oceans have warmed by 0.59 degrees Fahrenheit in the past century, the amount of phytoplankton worldwide dips by roughly 1 percent each year, according to a 2010 study published in the journal Nature
In fact, the study showed that phytoplankton concentrations have decreased by a total of 40 percent since 1950. The decline joins coral bleaching, sea-level rise, ocean acidification and a slowing of deep-water circulation (which effects water temps and weather patterns) as the known tolls of climate change on the oceans.
This drop in phytoplankton population is troubling because of this organism’s role in the marine food web. “Despite their microscopic size, phytoplankton… are harbingers of climate change in aquatic systems,” wrote the authors of a 2011 study on phytoplankton and climate change published in the journal Proceedings of the Royal Society. So understanding how other sea creatures will fare as climate changes depends on how drastically phytoplankton levels continue to drop.
The effects of a food shortage on big, open-ocean fish like swordfish and tuna, which already suffer from over-fishing, could pose problems for humans as well. “We’re squeezing from both ends,” Paul Falkowski, who runs the Rutgers University Environmental Biophysics and Molecular Ecology Lab, told Nature. “We’re overfishing the oceans for sure. Now we see there is pressure from the bottom of the food chain.”
Despite it’s importance, scientists have struggled to monitor phytoplankton, and analyzing all of the Earth’s oceans presents obvious logistical hurdles. Those challenges became apparent after one recent study concluded climate change is not to blame for dwindling phytoplankton levels and another refuted that phytoplankton is vanishing at all–igniting debate within the scientific community. Enter the Plymouth study, which is attempting to end the dispute and fill in gaps in phytoplankton research by harnessing the millions of sailors and fishermen who cruise the world’s oceans to help measure phytoplankton levels in the upper reaches of the water.
The program relies on the Secchi app, a new smartphone app devised by the Plymouth scientists that’s named for the Secchi Disk (PDF)—a piece of equipment that’s been used to measure turbidity in water since its invention in 1865 by Italian scientist Pietro Angelo Secchi. “It’s arguably the simplest item of marine sampling equipment,” Plymouth’s Richard Kirby, a plankton biologist who’s heading up the project, told Surprising Science.
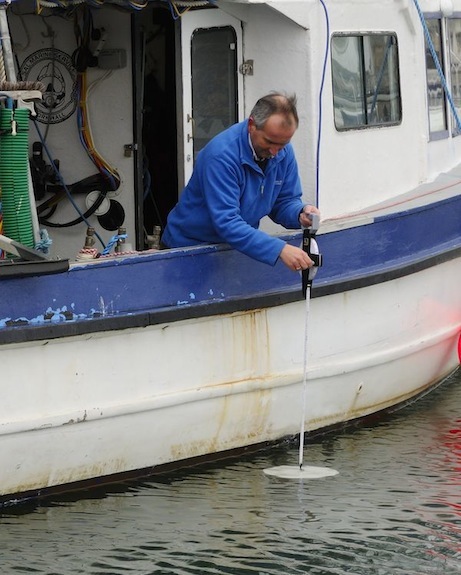
Plankton biologist Richard Kirby lowers a Secchi Disk into Britain’s Plymouth Sound. Photo courtesy of Richard Kirby
When a seafaring citizen scientist is ready to use the app, the first step is to make a Secchi Disk (instructions are included). The small, white disk–made of plastic, wood or metal–is attached to a tape measure on one side and a weight on the other. You hold the tape measure and lower the disk vertically into the seawater, and as soon as it disappears from sight, you note the depth on the tape measure. This number, the “Secchi depth,” reflects the transparency of the water column, which is influenced by the number of particles present. “Away from estuaries and areas where the turbidity of the water column may be influenced by suspended sediment, the Secchi Depth is inversely related to phytoplankton biomass,” Kirby says. The Secchi depth also tells scientists the depth to which light supports life in the water.
You enter the Secchi depth and the GPS location on your smartphone (a network connection isn’t required for this) into the app. The Plymouth researchers receive the data as soon as you regain network connectivity. You can also upload photos and type in additional details like water temperature (measured by the boat) and notes on visual observations–say, a foamy surface, a plankton bloom or a flock of feeding sea birds.
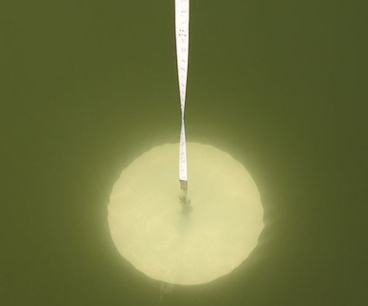
A Secchi Disk submerged in Britain’s Plymouth Sound. Photo by Richard Kirby
The Plymouth researchers hope ocean-goers across the globe will participate in the research, with which they will build a database and a map of the oceans charting both the seasonal and annual changes in phytoplankton levels to help scientists studying climate change and the oceans. “One person recording a Secchi depth twice a month for a few years will generate useful data about their local sea,” Kirby says. “The more people that take part, the greater the project and the more important and valuable it will become to future generations.”
Kirby notes that citizen scientists have long provided valuable data on long-term changes to the environment, and sees the internet as big opportunity to unite the efforts of citizen scientists. “We often look back and wish we had started monitoring something about the natural world,” he says. “‘If only we had started measuring ‘x’ ten years ago.’ Well, there is no time like the present to start something for the future.”