Everything You Need to Know About Arctic Sea Ice Melt, in One 10-Second Animated Gif
The Arctic is melting,
/https://tf-cmsv2-smithsonianmag-media.s3.amazonaws.com/accounts/headshot/smartnews-colin-schultz-240.jpg)
/https://tf-cmsv2-smithsonianmag-media.s3.amazonaws.com/filer/2012080609400608_06_2012_sea-ice.gif)
Trying to fit all of the subtle, stacking cycles that affect the Arctic into one image is a difficult feat. You’ve got your annual cycle, with summer melt and winter freeze. You’ve also got your interannual variability, where weather makes some summers see more melt than others. And you’ve got your decadal or centennial variations, that guide the long arc of the melt. That is what makes the above graphic, by statistician Grant Foster, so interesting.
Though data analysts and artists do their best, pictures that try to show all these things simultaneously often come out as a mess of squiggly lines.
Others opt to split it up, and show only one part of the story at a time. The National Snow and Ice Data Center does this, with two different views of ice extent: a snapshot and a long-term trend.
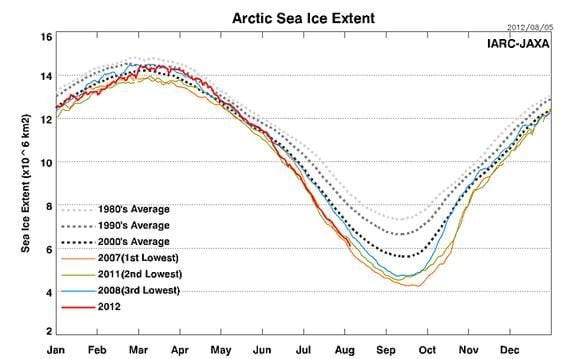
Foster also has additional graphics for sea ice extent and sea ice volume. The thing that differentiates sea ice extent from the similar-sounding sea ice area is that sea ice extent uses a cut-off value. So, where sea ice area tries to capture the surface area covered by Arctic ice, extent counters partition the ocean into a grid and count the surface area of grid squares that have at least 15% (or some other threshold) ice coverage.
More from Smithsonian.com:
Miners, Drillers Push Into Void Left By Melting Arctic Ice
Stunning View of Arctic Could Be Last of its Kind
Who Discovered the North Pole?
/https://tf-cmsv2-smithsonianmag-media.s3.amazonaws.com/accounts/headshot/smartnews-colin-schultz-240.jpg)