2012 Saw the Second Highest Carbon Emissions in Half a Century
For more than 50 years observations from Hawaii have tracked rising carbon dioxide. We’re still ignoring those warnings
/https://tf-cmsv2-smithsonianmag-media.s3.amazonaws.com/accounts/headshot/smartnews-colin-schultz-240.jpg)
/https://tf-cmsv2-smithsonianmag-media.s3.amazonaws.com/filer/2013030707502003_06_2013_gold-star.jpg)
Researchers at the National Oceanographic and Atmospheric Administration announced that 2012 saw the second highest single-year rise in the atmospheric concentration of carbon dioxide on record. It’s an unnerving new record, one that flies in the face of efforts to mitigate ongoing global warming. Since 1959, when a young researcher began tracking the atmospheric concentration of carbon dioxide and first alerted the world to the potential threat of an amplified greenhouse effect, only 1998 has seen a larger jump.
The basic science of global warming is often traced back to the late 19th century work of Svante Arrhenius, a Swedish physicist who had a hobbyist’s interest in the Earth sciences and wrote about the impact carbon could have on global temperatures in “On the Influence of Carbonic Acid in the Air upon the Temperature of the Ground.” But it wasn’t until the late 1950s that scientists began linking the theory of global warming to observations.
Charles David Keeling, a young researcher from the Scripps Institution of Oceanography in San Diego—just a few years out of completing his PhD—set off on an extensive survey of the atmospheric concentration of carbon dioxide. Pulling observations from ships and air-borne sensors and, most importantly, the Mauna Loa Observatory, a research station nestled on Hawaii’s Mauna Loa volcano (helpfully tucked far away from the heavy emissions of big cities), Keeling unveiled for the first time evidence of a persistent, prolonged upward climb in atmospheric carbon dioxide.
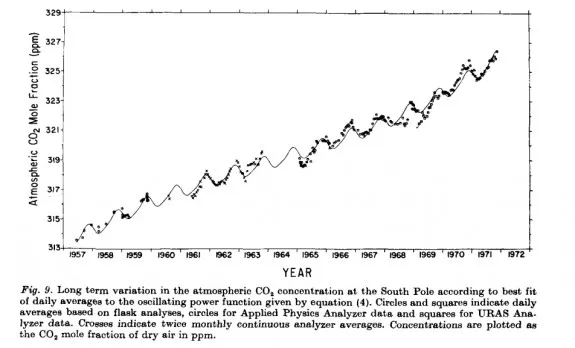
As growing plants absorb carbon dioxide in the summer and exhale as their leaves fall in the winter, carbon levels naturally go up and down. But hidden among the ebb and flow of the seasonal carbon cycle, Keeling found the upward tick of the global atmospheric carbon dioxide concentration, a pattern portrayed in the now-famous Keeling Curve.
Sometimes scrambling to keep the funding for his Mauna Loa observations flowing, Keeling and his students and colleagues managed to keep the record going for decades. NOAA uses measurements made from the same Mauna Loa station to measure the atmosphere’s carbon dioxide content today. Seth Borenstein for the Associated Press:
The amount of heat-trapping carbon dioxide in the air jumped dramatically in 2012, making it very unlikely that global warming can be limited to another 2 degrees as many global leaders have hoped, new federal figures show.
… Tans tells The Associated Press the major factor is ever-rising fossil fuel burning: “It’s just a testament to human influence being dominant.”
… In 2009, the world’s nations agreed on a voluntary goal of limiting global warming to 3.6 degrees Fahrenheit over pre-industrial temperature levels. Since the mid-1800s temperatures haven already risen about 1.5 degrees. Current pollution trends translate to another 2.5 to 4.5 degrees of warming within the next several decades, Reilly says.
“The prospects of keeping climate change below that (2-degree goal) are fading away,” Tans says.
More from Smithsonian.com:
There’s a Reason It’s Called Global Warming: European Emissions Rise From Imported American Coal
Canadian Government Winds Down Research That Could Help Stop Climate Change
/https://tf-cmsv2-smithsonianmag-media.s3.amazonaws.com/accounts/headshot/smartnews-colin-schultz-240.jpg)